What’s going on in financial markets? Which macro themes should you watch? Drawing on our depth and breadth of market and economic expertise, Market Pulse brings you insights on the latest investment themes to help preserve and grow your wealth.
Market views
- It was a choppy week for markets. Enthusiasm for a US debt ceiling deal improved late in the week. The proposed agreement must now pass the Houses of Congress. Market focus was on stronger growth data in the US, and weakness in Europe, combined with mixed inflation data points, as well as US earnings reports.
- Bond yields moved higher last week on growth and inflation data. Yield curves became more inverted as rate cut expectations faded. The US 2-year yield increase 0.29% to 4.56% and the 10-year increased 0.11% to 3.80%. Euro area yield moves were smaller but led to the same steeper inversion. UK bond yields saw the biggest moves, with the 2-year yield up over 0.49% on higher core inflation news. Global liquidity is likely to continue to decline as Europe moves further into quantitative tightening as bank funding facilities mature and asset purchase programmes unwind.
- Global equities ended the week up 0.24% in euro terms last week. The US, up 1.1% was the only major region to rise; Europe, -1.45% was weakest. Sector wise, IT rose 5% and everything else declined by 0.5% to 2.5%, with Materials and Consumer Staples the weakest sectors. The technology leadership reflected strong semiconductor results and the demand outlook for Artificial Intelligence applications.
Macro views
- The US and European PMI surveys continue to suggest services growth remains robust, and stronger than anticipated. Manufacturing is slower, and in the US dipped below the 50 mark again. Demand is slowing, but there’s been no cliff edge fall.
- Core CPI inflation in the UK of 1.2% month-on-month, and 6.8% year-over year, 0.8% higher than expected and up from 6.2% last month, seems to have been the most unanticipated data point last week. UK 2-year bond yields rose 0.5% after news as the Bank of England is now expected to hike rates at least three more times rather than two.
- Estimated US Q1 sequential real GDP growth was revised upwards to 1.3% from 1.1% in the initial estimate. The PCE price index was unchanged from the initial estimate of 4.2%, but Core PCE was revised higher by 0.10% to 5.0%. There were some material negative updates to Q4 personal income that might suggest a weaker labour market than previously thought.
- US Personal Consumption Expenditure (PCE) data released Friday showed very strong spending, up 0.80% m/m. The Core PCE deflator, the Fed’s preferred inflation gauge came in at 0.38%, 0.08% higher than forecast, and up from 0.31% last month. Used autos impacted goods inflation while housing and health care services pulled up services inflation. The Core PCE trend has been stable at 4.6 – 4.7% y/y since December 2022.
- The US FOMC minutes from the last meeting were released. While a June pause remains the expected case, the minutes highlight risk as some inflation indicators have remained stubbornly high despite evidence of slowing growth and easing labour market conditions. June payrolls and CPI data will be key before the next decision.
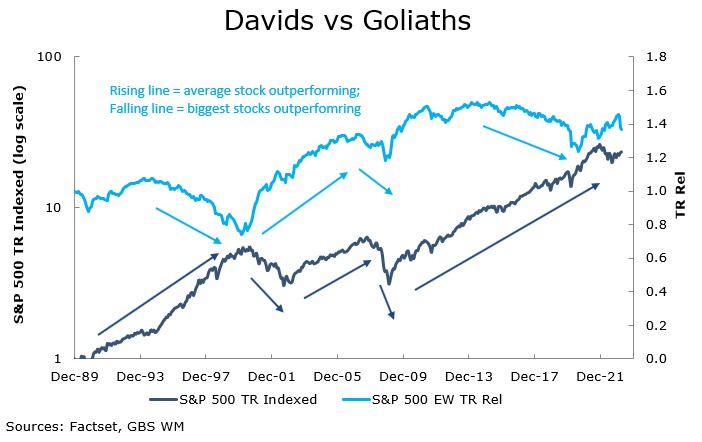
Chart of the week: S&P 500 vs S&P Equal Weighted
This week’s chart revisits a recent subject with a wider lens, the performance of the average stock compared the largest stocks. It shows the total return of the S&P 500 and the relative return of the S&P 500 Equal Weighted Index to the market cap weighted S&P 500. Despite much commentary about recent market performance being ‘too narrow’, i.e., only attributable to a few of the largest stocks, and therefore unsustainable, a quick look at history undermines this hypothesis. The S&P 500 has both risen and fallen when the average stock was outperforming or underperforming. To explain, most equity market indices are market-capitalisation weighted, i.e., the dollar value of the equity of companies (shares outstanding multiplied by the share price), is the basis for their weight in an index. As such, a small number of large-cap stocks may come to dominate an equity index, such as the S&P 500. So, a 10% move in a 10% weighted company adds 1% to index performance while a 10% move in a 1% weighted company only adds 0.1%. The S&P 500 is currently as concentrated in as it has been since the TMT bubble, although the valuations of the largest stocks are far more reasonable now than back then, but that’s an aside. The key takeaways are to ignore much of the noisy commentary that passes as analysis, and to ensure equity portfolios are appropriately diversified.
What would you like to do next?
Talk to us | Read more insights | Read our investment approach |


